

Best AI Tools for Video Engagement Insights: Top 8 in 2026

TL;DR: AI tools for video engagement insights analyze viewer behavior to show what holds attention. Kaltura fits enterprise portals and events, Brightcove media funnels, Panopto training comprehension, and Wistia marketing conversions.
What are AI tools for video engagement insights?
AI tools for video engagement transform raw viewer metrics into actionable optimization strategies by analyzing heatmaps, audience drop-off, transcription sentiments, and platform-wide performance. These platforms pinpoint exact moments viewers re-watch or bail, helping creators fine-tune thumbnails, titles, and hooks.
Key capabilities include:
- Automated video tagging and metadata generation: Automatically identifies people, objects, topics, and scenes to generate searchable tags, descriptions, and metadata at scale.
- Scene-level and frame-level analysis: Examines individual scenes and frames to identify engagement patterns, key moments, and visual elements that influence viewer behaviour.
- Sentiment and emotion analysis: Detects emotional tone in video content and audience reactions to measure how different moments affect engagement.
- Audience segmentation: Groups viewers by demographics, interests, and behaviour to uncover engagement trends across different audience segments.
- Predictive engagement analytics: Forecasts watch time, retention, and conversion performance using historical viewing data and machine learning models.
- Content performance benchmarking: Compares videos against historical results, internal libraries, competitors, or industry benchmarks to identify improvement opportunities.
- Personalized video recommendation: Recommends relevant videos to individual viewers based on their viewing history, preferences, and engagement patterns.
- Automated highlights and clip generation: Extracts the most engaging moments from long-form videos and repurposes them into short, shareable clips.
This is part of a series of articles about video platforms
AI tools for video engagement insights at a glance
The table below summarizes the key differences between the tools covered in this guide, including who each one fits and what to watch out for. We explore each of them in more detail in the sections that follow.
| Category | Solution | Best for | Key strengths | Things to consider |
| Enterprise video platforms | Kaltura | Enterprises measuring engagement across portals and events | Granular viewer tracking, BI integrations, real-time dashboards | Consolidating some reports takes extra setup effort |
| Enterprise video platforms | Brightcove | Media and marketing teams tracking audience and funnel impact | Engagement scoring, per-player reports, automated exports | Campaign-level reporting can be hard to navigate |
| Enterprise video platforms | Panopto | Training and education teams measuring viewing and comprehension | Per-viewer heatmaps, quiz analytics, library reporting | Deeper trend dashboards require a paid add-on |
| Enterprise video platforms | Vimeo | Teams tracking retention and event engagement in one dashboard | Second-by-second heat maps, event analytics, BI APIs | Detailed analytics need a paid plan and the native player |
| Enterprise video platforms | JWX | Publishers measuring content and ad performance across screens | Server-side collection, real-time viewer data, exports | Reporting is weaker for long-term series analysis |
| Marketing and sales analytics | Vidyard | Sales and marketing teams tying video views to pipeline | Viewer-level notifications, CRM data push, team dashboards | Deeper analytics and integrations sit on paid tiers |
| Marketing and sales analytics | Wistia | Marketers linking video engagement to leads and conversions | Per-viewer heatmaps, A/B testing, conversion and webinar data | Costs rise with storage and bandwidth use |
| Marketing and sales analytics | Cincopa | Smaller teams needing viewer-level engagement reporting | Viewer-level heatmaps, live feed, identified-viewer data | Reporting scope is narrower than enterprise suites |
Key video engagement metrics AI tools can analyze
Watch time and average view duration
Watch time measures the total time viewers spend watching a video, while average view duration measures the typical length of time each viewer watches before exiting. These metrics are foundational for assessing overall video performance. AI tools can aggregate and analyze watch time across different videos, campaigns, or platforms, helping organizations identify which content holds attention and which loses viewers quickly. By understanding these patterns, creators can adjust video length, pacing, or structure to align with audience preferences.
Average view duration, when tracked over time and across different audience segments, reveals deeper engagement trends. AI systems can highlight correlations between content features, such as topic, style, or presenter, and longer viewing sessions. This information can drive targeted improvements, such as editing out sections that consistently lead to drop-offs or expanding on subjects that hold attention. Over time, optimizing for watch time and view duration can significantly boost the effectiveness of video content strategies.
Viewer retention and drop-off points
Viewer retention tracks the percentage of viewers who continue watching a video over its entire duration, often visualized as a retention curve. Drop-off points indicate the moments when viewers stop watching in large numbers. AI tools automatically identify these points and correlate them with video elements, such as transitions, content shifts, or calls to action. This allows creators to pinpoint where interest wanes and investigate potential causes, such as irrelevant segments, slow pacing, or confusing messages.
By mapping retention and drop-off data to specific timestamps, AI-powered analytics enable refinement of content structure and improvement of the viewer experience. For example, repeated drop-offs at a particular scene might indicate the need for re-editing or additional context. Conversely, segments with high retention can be studied to replicate their success in future videos. Over time, systematic use of these insights leads to more engaging video content.
Play rate and completion rate
Play rate measures the percentage of people who click “play” on a video after seeing it, providing an indicator of how compelling the video’s thumbnail, title, and placement are. AI tools can analyze play rates in relation to different thumbnails, headlines, or embedding locations, allowing content teams to experiment with various options and optimize for higher engagement. Low play rates can signal issues with video promotion or relevance to the intended audience.
Completion rate tracks the percentage of viewers who watch a video to the end. AI-driven analysis can reveal which factors, such as video length, structure, or interactive elements, drive completions. By segmenting completion rates by device, location, or audience demographic, AI tools help organizations tailor their video strategies to specified viewer groups. Improving both play rate and completion rate increases the impact and ROI of video content.
Rewatches, skips, and scrubbing behavior
Rewatch behavior indicates segments of a video that viewers find valuable or confusing, as users frequently replay certain parts. AI tools can detect patterns in rewatches, highlighting moments that deserve further emphasis or clarification in future content. High rewatch rates on specific sections may also signal effective storytelling, memorable visuals, or critical information that resonates with the audience.
Skips and scrubbing behavior, when viewers fast-forward or skip through parts of a video, reveal less engaging sections. AI analytics map these actions to timestamps, providing insight into content pacing and viewer interest. Frequent skipping might indicate slow introductions, off-topic tangents, or repetitive material. By adjusting content based on these insights, creators can maintain attention and reduce disengagement.
Click-through and conversion rates
Click-through rate (CTR) measures the percentage of viewers who interact with clickable elements in a video, such as calls to action, links, or annotations. AI tools can track and analyze CTRs across different placements, content formats, and audience segments, helping organizations understand which messages or creative elements drive engagement. Low CTRs may indicate that calls to action are poorly timed or unclear.
Conversion rate measures the percentage of viewers who complete a desired action after watching a video, such as signing up, making a purchase, or downloading content. AI-powered analytics can attribute conversions to video features, segments, or audience demographics, enabling data-driven optimization of video marketing funnels. By refining content to improve both click-through and conversion rates, organizations can increase the business impact of their video assets.
Engagement by audience segment
Analyzing engagement by audience segment allows organizations to understand how different groups interact with video content. AI tools can segment viewers by demographic factors such as age, gender, location, or by interests and behavior patterns. This segmentation uncovers engagement trends, revealing which topics, formats, or lengths resonate with each group. These insights support targeted content creation and personalized video strategies.
By monitoring engagement at the segment level, organizations can adapt their content mix to better serve high-value audiences or address underperforming segments. For example, if younger viewers consistently drop off earlier, creators can experiment with pacing or style adjustments tailored to that demographic. Over time, segment-based analysis keeps video strategies aligned with audience needs and preferences.
Engagement across devices and channels
Viewer engagement varies across devices—desktop, mobile, tablet, and smart TV—and across distribution channels, including websites, social media, and apps. AI tools analyze how device type and channel affect watch time, retention, and interaction rates. For example, mobile viewers may prefer shorter videos, while desktop users might engage more with in-depth content.
Channel-specific insights also inform distribution strategies. AI-driven analysis can reveal that certain videos perform better on specific social platforms or within branded apps. By tailoring video length, format, and interactive elements to each device and channel, organizations can optimize engagement across environments.
Key capabilities of AI video engagement tools
1. Automated video tagging and metadata generation
Automated video tagging uses AI to identify and label key objects, scenes, people, and actions within video content. This process generates metadata that makes videos easier to search, categorize, and recommend. By using computer vision and natural language processing, AI tools can tag content at scale with greater consistency than manual processes. This capability is important for large video libraries, enabling efficient content management and discovery.
Metadata generation also supports personalized recommendations, content filtering, and targeted advertising. By associating detailed tags with each video or scene, AI systems can match content with user preferences and search queries. As a result, organizations see improved user experience, increased watch time, and higher engagement rates.
2. Scene-level and frame-level analysis
Scene-level and frame-level analysis breaks videos down into segments or individual frames, allowing granular assessment of content and viewer interactions. AI tools can detect scene changes, identify key moments, and analyze visual and audio elements at a fine-grained level. This enables precise measurement of which parts of a video drive engagement, retention, or drop-off.
By analyzing content at the frame level, AI systems can also identify subtle cues, such as facial expressions, on-screen text, or rapid movement, that influence viewer response. This level of detail helps creators refine storytelling, pacing, or visual impact.
3. Sentiment and emotion analysis
Sentiment and emotion analysis uses AI to interpret the mood and emotional tone of video content, as well as audience reactions. By processing audio, visual cues, and viewer comments, AI tools can classify moments as positive, negative, or neutral, and detect emotions such as excitement, sadness, or surprise. This analysis helps creators understand how their content affects viewers emotionally.
Audience sentiment data can also reveal correlations between emotional tone and engagement metrics, such as retention or conversion rates. For example, videos that evoke positive emotions may lead to higher sharing rates. By using sentiment and emotion insights, organizations can refine storytelling and align content with audience expectations.
4. Audience segmentation
Audience segmentation enables AI tools to group viewers based on shared characteristics such as demographics, interests, viewing habits, engagement levels, or purchase behavior. Rather than treating all viewers as a single audience, AI identifies patterns that reveal how different groups respond to topics or formats. This helps organizations understand which audiences are most engaged and where content improvements are needed.
AI-driven segmentation updates as viewer behavior changes. For example, the system may identify a segment that consistently watches educational videos to completion or another that prefers short-form content on mobile devices. These insights support targeted content planning and marketing campaigns.
5. Predictive engagement analytics
Predictive engagement analytics uses machine learning models to forecast how viewers are likely to interact with future video content. By analyzing historical engagement data alongside content characteristics, AI can estimate metrics such as watch time, completion rate, click-through rate, or the likelihood of audience drop-off. These predictions allow organizations to evaluate content before or shortly after publication and make proactive improvements.
Predictive models also help identify trends that may not be obvious through historical reporting alone. For example, an AI system may predict that a longer introduction will reduce retention for a particular audience segment. These forecasts support data-driven decisions while reducing reliance on trial and error.
6. Content performance benchmarking
Content performance benchmarking compares the results of individual videos against internal libraries, historical performance, competitors, or industry standards. AI tools automate these comparisons across engagement metrics, making it easier to determine whether a video’s performance is above or below expectations. This provides context that simple metric reporting cannot.
Benchmarking also identifies recurring characteristics of high-performing content. AI can detect common factors such as video length, publishing schedule, subject matter, or production style that correlate with stronger engagement. These insights guide future content strategies.
7. Personalized video recommendations
Personalized video recommendation systems use AI to suggest content based on each viewer’s interests, behavior, and viewing history. Instead of presenting the same videos to every user, recommendation engines analyze patterns across interactions to deliver content that is relevant to each individual.
Recommendation models learn from new interactions, refining suggestions as viewer preferences evolve. They can incorporate factors such as recently watched videos, search activity, session duration, and similarities between users with comparable interests. By delivering relevant recommendations, organizations increase watch time and long-term engagement.
Related content: Read our guide to AI video tools
8. Automated highlights and clip generation
Automated highlights and clip generation use AI to identify important or engaging moments within longer videos and convert them into shorter clips. The system analyzes visual content, speech, audience engagement signals, and scene transitions to select segments likely to capture attention.
Generated highlights can be tailored for different platforms and audiences. For example, AI can create short vertical clips for social media, concise meeting summaries, or highlight reels from webinars or product demonstrations. By automating clip creation, organizations can expand content distribution and improve discoverability.
Notable AI tools for video engagement insights
How we selected these tools: We shortlisted AI tools for video engagement insights based on viewer-level engagement tracking, retention and drop-off analysis, audience and content-level reporting, and the ability to move video data into other business systems.
Enterprise Video Platforms with built-in engagement analytics
1. Kaltura

Best for: Enterprises measuring engagement across portals and events
Strengths: Granular viewer tracking, BI integrations, real-time dashboards
Things to consider: Consolidating some reports takes extra setup effort
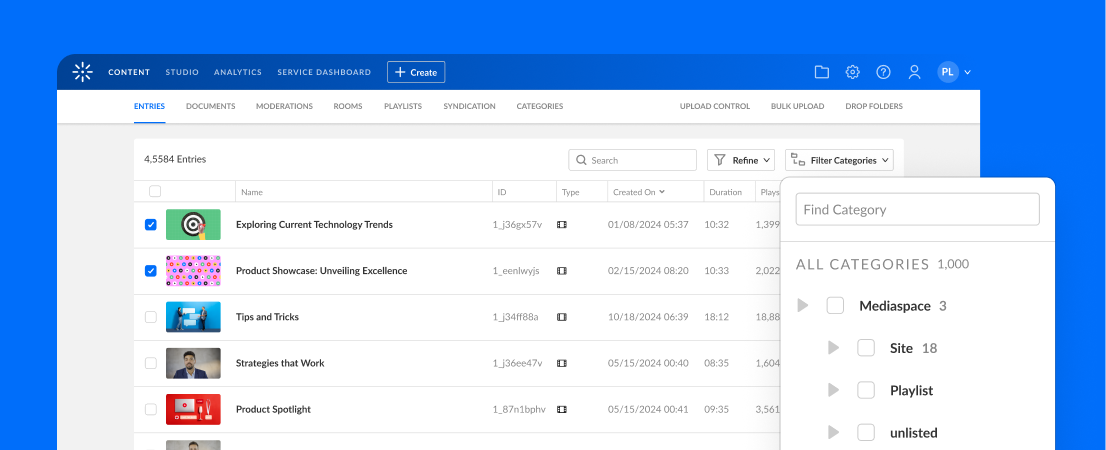
Kaltura’s video analytics reporting covers viewer behavior, content performance, and delivery quality across its video portal, events, and developer stack. Kaltura also offers real-time sentiment analysis with the AI assistant giving suggestions during events and webinars on how to enhance engagement with notifications, polls, and other interactive tools.
Data appears in dashboards, tables, and charts, with custom views that different teams can configure. Reporting draws on both real-time and historical data.
Engagement data can be tracked inside a Kaltura video portal and on external pages where content is embedded. The platform also connects video data to outside systems, and its AI suite handles metadata enrichment and content repurposing that feed back into what gets measured.
Key features include:
- Viewer tracking: Captures audience preferences and engagement at either a high level or a granular, per-user level.
- Interactivity and scoring reports: Deep user analytics and interactivity reports allow media to be compared, scored, and visualized.
- Embedded content analytics: Tracks and measures content both on the video portal hub and off it, giving cross-channel visibility into placements.
- Real-time traffic dashboards and AI-powered sentiment analysis: Surface current viewing activity.
- Stream monitoring: Tracks service quality, storage, and bandwidth in real time or over time.
- Third-party integrations: Connects to Google Analytics, Tableau, Marketo, and HubSpot.
- AI content enrichment: Content Lab generates highlight clips, quizzes, summaries, and metadata enrichment, while optical character recognition and automatic speech recognition make spoken words and on-screen text searchable.
Limitations (as reported by users on G2):
- Report consolidation: Pulling every available data point into a single report can require API work or assistance.
- Metric coverage: Some reviewers have asked for additional breakdowns, such as average consumption time by content and by user.
- Initial configuration: The range of settings and dashboards means new administrators need time to find the views they need.

Source: Kaltura
2. Brightcove

Best for: Media and marketing teams tracking audience and funnel impact
Strengths: Engagement scoring, per-player reports, automated data exports
Things to consider: Campaign-level reporting can be hard to navigate
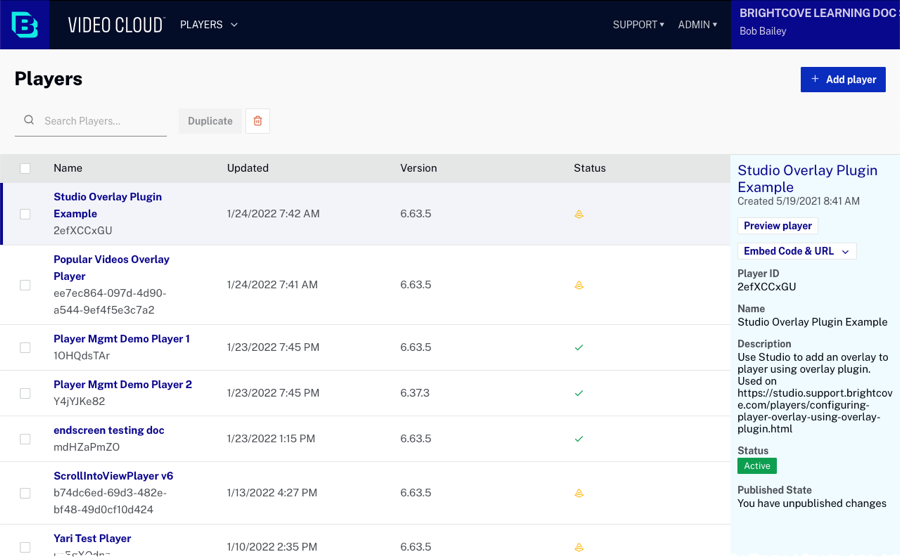
Brightcove Analytics reports on audience behavior and content performance using first-party playback data combined with integrated third-party sources. Tracked metrics include engagement score, daily unique viewers, play requests, live seconds streamed, and player load time.
Reporting covers subscriber retention, ad break completion, and how engagement levels move through the funnel. Built-in reports are supplemented by an open API for custom dashboards, and audience reports can be exported automatically into marketing tools.
Key features include:
- Engagement score reporting: A composite engagement metric sits alongside raw counts such as play requests and unique viewers.
- Funnel and subscriber analysis: Reports connect engagement levels to pipeline contribution and subscriber retention.
- Per-player and per-placement reports: The same video can be compared across different locations on a site.
- Trend reporting: Trend lines and performance insights show how metrics move over time.
- Automated data export: Audience reports can be pushed on a schedule into marketing automation tools and other platforms.
- Open API access: Developers can query the analytics module directly.
- Playback quality metrics: Player load time is tracked alongside engagement data.
Limitations (as reported by users on G2):
- Reporting usability: Reviewers describe the statistics interface as not very manageable or intuitive.
- Analytics gaps: Requests appear for deeper quality-of-experience reporting and fuller live streaming metrics.
- Learning curve: The breadth of products and feature naming makes it hard for new users to navigate.
- Processing delays: Slow imports and transcoding have been reported.
- Cost: Pricing is described as steep for smaller organizations.

Source: Brightcove
3. Panopto

Best for: Training and education teams measuring viewing and comprehension
Strengths: Per-viewer heatmaps, quiz analytics, library-level reporting
Things to consider: Deeper trend dashboards require a paid add-on
Panopto tracks how each viewer engages with every recording, including how much they watched, what percentage they completed, how they accessed the content, and their individual viewing history. Per-viewer engagement heatmaps visualize viewing density across a recording’s timeline.
Heatmaps surface moments that consistently lose the audience and moments viewers return to repeatedly, including where they paused, rewound, or dropped off. Viewing data sits alongside in-video assessment results, so completion can be compared with comprehension.
Key features include:
- Per-viewer engagement data: Watch time, percentage completed, access method, and viewing history are recorded for each viewer.
- Engagement heatmaps: Visualize attention and interaction across the timeline of a recording.
- In-video quiz analytics: Knowledge check results are tracked alongside viewing data and feed many LMS gradebooks.
- Library and content performance reporting: Shows which videos are watched, how often, and by whom.
- Compliance and audit reporting: Records who accessed which content and when.
- Creator activity tracking: Reports on how much content is produced and by whom.
- Knowledge insights add-on: Adds dashboards for usage, retention, and session insights with month-over-month and year-over-year comparisons, threshold alerts, and connectors for Tableau, Power BI, and Looker.
Limitations (as reported by users on G2):
- Platform speed: Reviewers describe the interface as slow or clunky.
- Feature gating: Several enhanced capabilities sit behind paid tiers or add-ons.
- Admin reporting: Some administrators report that reports are hard to locate.
- Editing tools: The built-in editor is described as basic.
- Pricing: Cost and price increases are raised as concerns.

Source: Panopto
4. Vimeo

Best for: Teams tracking retention and event engagement in one dashboard
Strengths: Second-by-second heat maps, event analytics, BI integrations
Things to consider: Detailed analytics need a paid plan and native player
Vimeo’s browser-based analytics dashboard reports views, impressions, and watch time across devices, then goes deeper into how people watch and when they stop. Engagement heat maps provide second-by-second retention and drop-off analysis, and finish rate monitoring tracks completion patterns.
Reporting follows videos wherever they are embedded, with embed source tracking and geographic breakdowns by region, country, and city. Team analytics, event analytics, and APIs extend the same data into training compliance, webinars, and business intelligence tools.
Key features include:
- Engagement heat maps: Provide second-by-second viewer retention and drop-off analysis.
- Team member analytics: Track which team members watched required videos.
- Event and webinar analytics: Measure live audience engagement in real time and connect results to CRM systems such as HubSpot and Salesforce.
- Custom reports: Filters run across Workspaces, folders, Showcases, videos, and events.
- Embed source tracking: Shows where videos are embedded and how each placement performs.
- BI and API access: APIs feed tools including Tableau, Looker, Power BI, ThoughtSpot, and Qlik Sense.
- Intelligent video analytics: AI and machine learning are applied to viewer behavior and trends.
Limitations (as reported by users on G2):
- Plan gating: Engagement metrics and geographic data require a paid plan.
- Cost as usage grows: Pricing and storage allowances are described as restrictive at scale.
- Managing large libraries: Navigation is described as less intuitive for large libraries.
- OTT reporting depth: Analytics for the streaming product are described as basic by some users.
- Support response: Non-enterprise users report slower support turnaround.

Source: Vimeo
5. JWX (formerly JW Player)

Best for: Publishers measuring content and ad performance across screens
Strengths: Server-side collection, real-time viewer data, flexible exports
Things to consider: Reporting is weaker for long-term series analysis
JWX playback analytics present 90 days of performance data in a visual dashboard covering top-performing content, device types, regions, and referring domains. Video plays can be compared against ad impressions and completions, and reports can be built and exported to match specific KPIs.
Data collection is player-agnostic and runs server-side, which keeps reporting working across HLS, DASH, and DRM-protected streams, even where anti-tracking measures block client-side scripts. Real-time analytics cover active viewer sessions in a rolling window.
Key features include:
- Playback analytics dashboard: Surfaces top-performing content, device types, regions, and referring domains.
- Server-side data collection: Collects streaming analytics at server level.
- Player-agnostic tracking: Works with live and VOD streams across HLS, DASH, and DRM-protected formats.
- Real-time analytics: Monitors viewer actions in a two-minute window.
- Google Analytics integration: Captures buffer, pause, resume, and seek events plus video plays and completion rates.
- Custom reports: Pre-built summaries sit beside reports customizable by source and metrics.
- Data sharing: Data can be exported into a data warehouse through a Snowflake connection.
Limitations (as reported by users on TrustRadius):
- Reporting usability: Analytics are described as cumbersome.
- Longitudinal analysis: Following the analytics of a video series across an extended period is described as difficult.
- Account management: Reviewers note the absence of revision history.
- Support responsiveness: Technical support is described as slow to reply.
- In-video interactivity: Adding clickable text and links inside a video is described as harder than on comparable platforms.

Source: JWX
Video Marketing and Sales Engagement Analytics Tools
6. Vidyard

Best for: Sales and marketing teams tying video views to pipeline
Strengths: Viewer-level notifications, CRM data push, team dashboards
Things to consider: Deeper analytics and integrations sit on paid tiers
Vidyard reports on who watched a video, when they watched it, and how much they watched, with view notifications sent as videos are opened. Dashboards show which videos hold attention and convert, and team performance dashboards break engagement down by individual rep.
View data can be pushed into Salesforce, Marketo, and HubSpot to score, segment, and nurture leads. A separate AI video insights view reports on adoption and performance of AI-generated videos across a team.
Key features include:
- View notifications: Alert reps as soon as a video is watched.
- Engagement dashboards: Report which videos are engaging and converting viewers.
- Team performance dashboards: Show which team members are most active with video.
- CRM and marketing automation integrations: Push view data into Salesforce, Marketo, and HubSpot.
- CRM record enrichment: Adds viewing data to contact records.
- AI video insights: Report which AI videos drove the most views and engagement.
- In-video CTAs and search optimization: Clickable calls to action inside videos generate measurable next steps.
Limitations (as reported by users on G2):
- Tier gating: More detailed analytics and CRM integrations sit behind paid plans.
- Analytics depth: Some reviewers say reporting could offer deeper insight.
- Viewer attribution: Identifying which contact watched which video can be harder with stacked links.
- Performance: Interface lag is reported with large files.
- Editing tools: Post-recording editing is limited to trimming and clipping.

Source: Vidyard
7. Wistia

Best for: Marketers linking video engagement to leads and conversions
Strengths: Per-viewer heatmaps, A/B testing, conversion and webinar data
Things to consider: Costs rise with storage and bandwidth use
Wistia reports engagement at account, project, and individual video level. Video heatmaps show which sections each viewer watched, rewatched, and skipped, along with the device and web page used. Second-by-second play and replay stats sit beside total plays, play rate, and average engagement.
Views are tracked by embed location and traffic source, with UTM codes breaking performance down by campaign, source, and medium. Conversion reporting and webinar analytics extend the same data into lead generation and event follow-up.
Key features include:
- Video heatmaps: Show which parts of a video each viewer watched, rewatched, and skipped.
- Second-by-second engagement stats: Identify the most engaging segments.
- Embed location tracking: Performance is reported per embed.
- Traffic source reporting: UTM codes break video traffic down by campaign, source, and medium.
- A/B testing: Serves two thumbnails, videos, or versions to an audience.
- Conversion reporting: Shows what percentage of viewers acted on calls to action and forms.
- Webinar analytics: Report impressions, registrants, attendees, and engagement.
- Marketing automation integrations: Trigger workflows when a viewer passes a set percentage of a video.
Limitations (as reported by users on G2):
- Pricing at scale: Costs rise as library size and bandwidth grow.
- Tier gating: Some analytics and customization options are only available on higher-tier plans.
- Reporting flexibility: Consolidated views across multiple videos are described as less flexible than some users want.
- Large libraries: Heavy users report backend slowdown.
- AI tooling: Repurposing output often needs manual correction.

Source: Wistia
8. Cincopa

Best for: Smaller teams needing viewer-level engagement reporting
Strengths: Viewer-level heatmaps, live feed, identified-viewer reporting
Things to consider: Reporting scope is narrower than enterprise suites
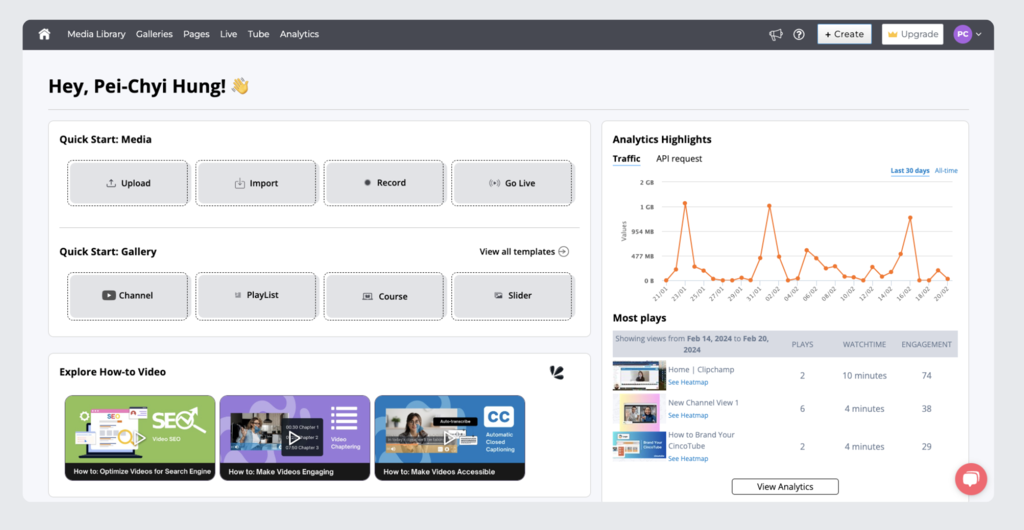
Cincopa reports video engagement down to the individual viewer. A dashboard aggregates video statistics for a selected timeframe and graphs how they change over time, while video heatmaps show viewing patterns and drop-off points.
A live feed lists each person who watched a video with their viewing heatmap and engagement rate. Where a viewer is identified, contact details appear alongside behavioral data.
Key features include:
- Aggregate analytics dashboard: Presents video statistics for a selected timeframe as a graph.
- Live feed: Provides information about each person who watched a video.
- Video heatmaps: Reveal how the audience engages across a video and where drop-offs occur.
- Viewer profiles: Show location, viewing time, average engagement, and platform.
- Identified-viewer reporting: When a viewer is identified through a form or API, their name and email are attached to viewing data.
- KPI measurement: Engagement and key performance indicators are reported together.
Limitations (as reported by users on TrustRadius)
- Storage allowances: Plan storage limits are raised as a constraint by users with larger libraries.
- Library organization: Sorting and reordering galleries can be awkward.
- Interface guidance: Tooltips do not always explain options clearly.
- Plan structure: Changes to packages have left some users on higher-cost plans than needed.
- Support timing: Replies can be delayed by a couple of hours.

Source: Cincopa
Conclusion
AI tools for video engagement insights help organizations move beyond basic view counts by revealing how audiences interact with video content at every stage of the viewing journey. By combining engagement metrics with AI-driven analysis, these platforms uncover patterns that support better content creation, distribution, personalization, and performance optimization. Whether the goal is increasing retention, improving conversions, or understanding audience behaviour across channels, AI-powered engagement analytics provide the data needed to make informed, measurable improvements over time.
Was this post useful?
Thank you for your feedback!