By Immanuel Vinikas
July 28th, 2026
2 min read
June 12th, 2026
6 Best Cvent competitors & alternatives for your events in 2026
By Bianca Belman-Adams
By Bianca Belman-Adams
June 12th, 2026
June 5th, 2026
The top 6 webinar platforms for seamless hosting in 2026
By Bianca Belman-Adams
By Bianca Belman-Adams
June 5th, 2026
June 5th, 2026
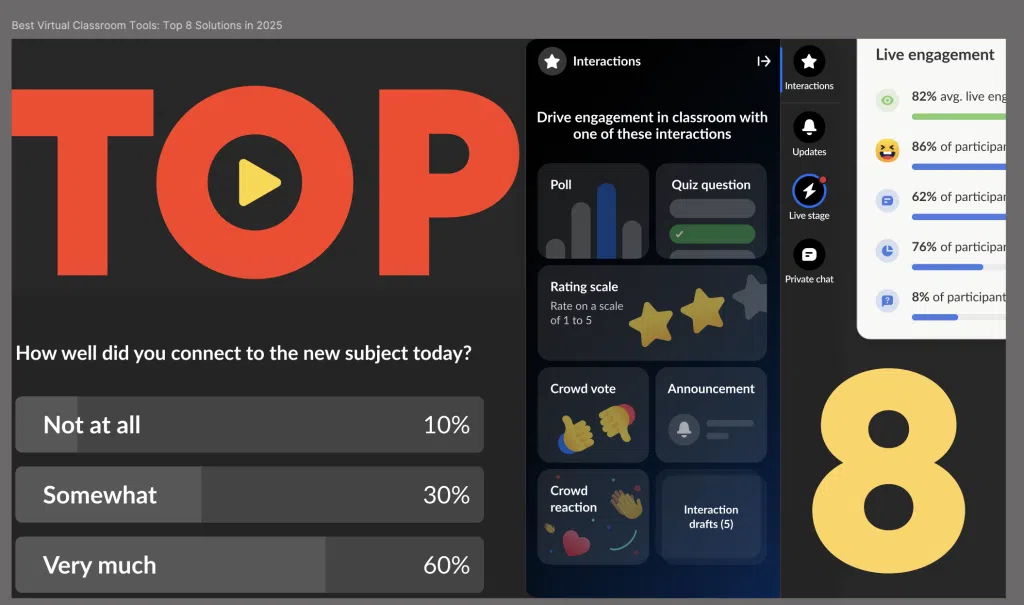
Best Virtual Classroom Tools: Top 8 Solutions in 2026
By Immanuel Vinikas
By Immanuel Vinikas
June 5th, 2026
June 5th, 2026
Best virtual event management in education: Top 6 solutions in 2026
By Immanuel Vinikas
By Immanuel Vinikas
June 5th, 2026
June 5th, 2026
Overview of the Best Virtual Events Platforms 2026
By Phil Henken
By Phil Henken
June 5th, 2026
June 5th, 2026
Enterprise video platforms comparison and overview
By Phil Henken
By Phil Henken
June 5th, 2026
May 22nd, 2026
Top 9 ON24 competitors to know in 2026
By Phil Henken
By Phil Henken
May 22nd, 2026
May 22nd, 2026
Corporate Learning Management System: 11 Solutions to Know in 2026
By Immanuel Vinikas
By Immanuel Vinikas
May 22nd, 2026
May 10th, 2026
The future of events in the age of AI agents
By Liad Eshkar
By Liad Eshkar
May 10th, 2026
May 8th, 2026
16 AI video tools for generating, editing & hosting video in 2026
By Immanuel Vinikas
By Immanuel Vinikas
May 8th, 2026
May 2nd, 2026
Best Agentic AI Tools: 20 Solutions to Know in 2026
By Immanuel Vinikas
By Immanuel Vinikas
May 2nd, 2026
May 1st, 2026
Video Platforms: Key Capabilities & 10 Solutions to Know in 2026
By Immanuel Vinikas
By Immanuel Vinikas
May 1st, 2026
May 1st, 2026
Virtual Conference Platforms: 10 Solutions to Know in 2026
By Immanuel Vinikas
By Immanuel Vinikas
May 1st, 2026
April 26th, 2026
The psychology of why conversation converts
By Immanuel Vinikas
By Immanuel Vinikas
April 26th, 2026
April 19th, 2026
When AI starts making decisions: Rethinking the customer journey
By Liad Eshkar
By Liad Eshkar
April 19th, 2026
April 15th, 2026
Best Online Video Platforms: Top 14 Solutions in 2026
By Immanuel Vinikas
By Immanuel Vinikas
April 15th, 2026
April 15th, 2026
Digital Asset Management (DAM) in 2026: Use Cases & Best Practices
By Immanuel Vinikas
By Immanuel Vinikas
April 15th, 2026
April 15th, 2026
Best Video Content Management Systems: Top 6 Tools in 2026
By Phil Henken
By Phil Henken
April 15th, 2026
April 15th, 2026
7 Best Virtual Classroom Software Solutions in 2026
By Roi Kaufman
By Roi Kaufman
April 15th, 2026
April 13th, 2026
The personalization gap
By Immanuel Vinikas
By Immanuel Vinikas
April 13th, 2026
April 12th, 2026
Kaltura Connect on the Road 2026
By Immanuel Vinikas
By Immanuel Vinikas
April 12th, 2026
April 8th, 2026
The 2026 guide to enterprise video content management
By Bianca Belman-Adams
By Bianca Belman-Adams
April 8th, 2026
February 22nd, 2026
Personalized Marketing Videos: Process, Examples & Best Practices
By Immanuel Vinikas
By Immanuel Vinikas
February 22nd, 2026
February 22nd, 2026
12 Internal Communications Tools to Know in 2026
By Immanuel Vinikas
By Immanuel Vinikas
February 22nd, 2026
February 22nd, 2026
7 Panopto Alternatives to Know in 2026
By Immanuel Vinikas
By Immanuel Vinikas
February 22nd, 2026
February 21st, 2026
Top 15 AI Agent Examples and Use Cases in 2026
By Immanuel Vinikas
By Immanuel Vinikas
February 21st, 2026
February 6th, 2026
Webinar Marketing Strategy: Comprehensive Guide & 10-Step Plan
By Meitav Marom
By Meitav Marom
February 6th, 2026
January 20th, 2026
Edtech: Technologies, Best Practices & Impact of AI
By Immanuel Vinikas
By Immanuel Vinikas
January 20th, 2026
January 20th, 2026
Complete Guide to AI Avatars: Types, Use Cases & Technologies
By Immanuel Vinikas
By Immanuel Vinikas
January 20th, 2026
January 20th, 2026
Generative art vs. AI art: A comprehensive guide
By Immanuel Vinikas
By Immanuel Vinikas
January 20th, 2026
January 20th, 2026
Top 10 cart abandonment solutions for eCommerce in 2025
By Immanuel Vinikas
By Immanuel Vinikas
January 20th, 2026
January 20th, 2026
Top 8 AI in retail examples you should know
By Immanuel Vinikas
By Immanuel Vinikas
January 20th, 2026
January 20th, 2026
AI in the hospitality industry: Trends in hotel service
By Immanuel Vinikas
By Immanuel Vinikas
January 20th, 2026
January 20th, 2026
Technology in education: Its importance, pros, and cons
By Immanuel Vinikas
By Immanuel Vinikas
January 20th, 2026
January 20th, 2026
How to write a training video script
By Immanuel Vinikas
By Immanuel Vinikas
January 20th, 2026
January 20th, 2026
SaaS video marketing strategy for growth: Examples and video types
By Immanuel Vinikas
By Immanuel Vinikas
January 20th, 2026
January 20th, 2026
The future of digital twins: Trends, use cases, and benefits
By Immanuel Vinikas
By Immanuel Vinikas
January 20th, 2026
January 20th, 2026
How does AI affect education? Benefits and challenges.
By Immanuel Vinikas
By Immanuel Vinikas
January 20th, 2026
January 20th, 2026
AI in curriculum design: Unlocking new possibilities in learning
By Immanuel Vinikas
By Immanuel Vinikas
January 20th, 2026
January 20th, 2026
Combining AI and special education: A comprehensive guide
By Immanuel Vinikas
By Immanuel Vinikas
January 20th, 2026
January 20th, 2026
How AI art teachers make learning art more engaging
By Immanuel Vinikas
By Immanuel Vinikas
January 20th, 2026
January 20th, 2026
Smart classrooms and their role in today’s schools
By Immanuel Vinikas
By Immanuel Vinikas
January 20th, 2026


 Kaltura Case Studies | Customer Success Stories & Use CasesGet inspired by how our customers engage audiences, build connections and achieve remarkable business results with Kaltura.Read more
 The future of events in the age of AI agentsExplore how AI is transforming physical and virtual events into intelligent, data-driven experiences that fuel future customer engagement.Read more
 When AI starts making decisions: Rethinking the customer journeyAI is shifting from assistant to decision-maker. Learn how it reshapes customer journeys, human roles, and how organizations stay in control.Read more